Longitudinal Mixed Model Explorer App
So far learning about mixed models have been challenging but fun. I guess it’s par for the course for doctoral students to do a lot of self-supervised non-linear learning.
When it comes to understanding statistics I feel like simulating data and applying methods to that has been helpful. I quite often get stuck, sometimes on dumb coding brainfarts, but other times because I have misunderstood something important. Especially with mixed models this has helped me understand why they’re interesting in the first place.
Still I got a bit frustrated with having to re-run my data generating function when exploring parameters, so now that the function is good enough I threw it in a shiny app.

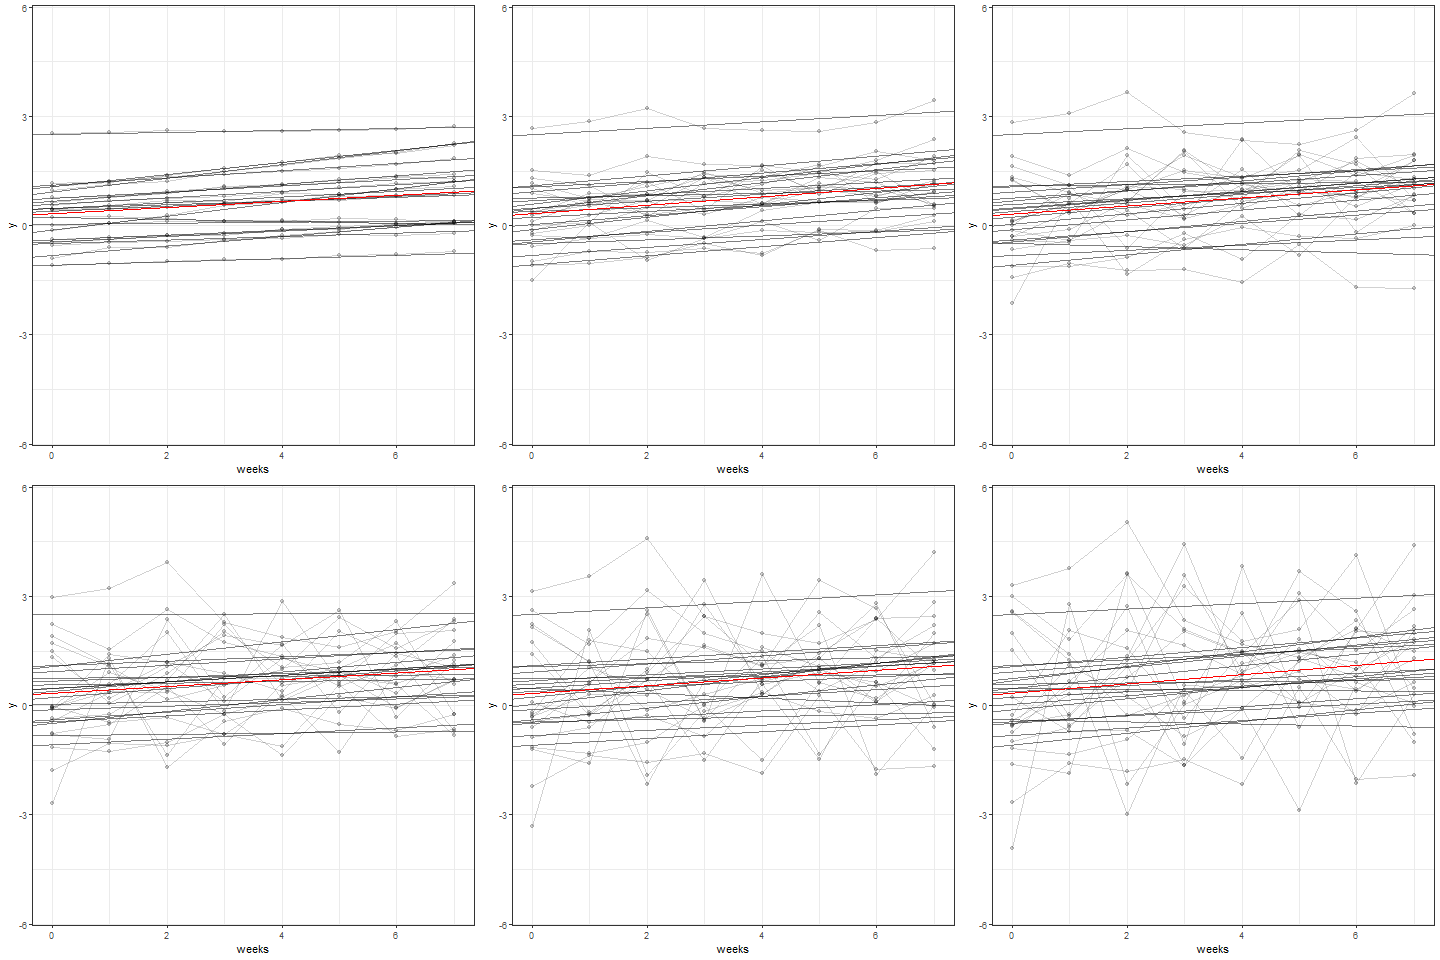
The app shows 20 “patients” over 8 weeks, modeled with random intercepts and slopes: lmer(y ~ week + (week|id), data). The intercept standard deviation of the intercepts is 1 (on average), so the fixed effect can be understood in relation to that.
Building the app went very quickly, but my first version re-generated the data every time the user changed a parameter. I thought that would be less helpful as a teaching tool. The finished app instead has scaling parameters that affects the residuals and the random slopes. Remaking it meant making the app a bit more complicated, and since the app re-fits the lme4 model every time, the advantage wasn’t as clear as I had hoped. Oh well.
One small thing I learned was that I should probably be thinking about whether it makes sense to set the intercept at week 0 or not. (It’s visually very clear that the intercepts are more stable for changes in the data than the predicted random effects at week 8).
I might improve the app further in the future (at least visually) if I find the time. For now it’s been a good learning experience that can hopefully be used as a minor teaching tool.